The Connectome 2.0 Scanner Captures the Brain in Unprecedented Detail
A one-of-a-kind MRI machine helps researchers see the relationship between the structure of the brain and how it functions
- 4 minute read
- Feature
A top-down view of the paths axons follow in the brain
Image: courtesy of Boris Keil

A top-down view of the paths axons follow in the brain
Image: courtesy of Boris Keil
The average human brain is only about the size of a cantaloupe. But packed within it is a dense network of billions of neurons and tens of thousands of miles of axons, the fibers that connect neurons to one another. This network, called the connectome, is thought to play an essential role in shaping both our personalities and, in some cases, pathologies, but its complexity has made it difficult to map in detail.
That’s changing, thanks in part to a one-of-a-kind MRI scanner — called the Connectome 2.0 — that is allowing researchers to create some of the highest resolution maps yet of the human connectome. The machine was installed at the Athinoula A. Martinos Center for Biomedical Imaging at Massachusetts General Hospital in 2023, and researchers are now using it to better understand the relationship between the structure of the brain and how it functions.
A typical MRI machine used in a hospital can identify abnormalities such as a blood clot or tumor. But many neurological and psychiatric conditions, such as severe depression or schizophrenia, are thought to result at least in part from abnormalities in the connectome. Those won’t show up on a standard MRI scan, “yet there is something wrong that we can’t see,” says Susie Huang, MD ’10, an HMS associate professor of radiology at Mass General and associate director of the Martinos Center.
Anastasia Yendiki, an HMS associate professor of radiology at Mass General, uses the Connectome 2.0 in her work as one of three principal investigators of the Center for Large-Scale Imaging of Neural Circuits (LINC), a long-term project funded by the NIH BRAIN Initiative. She is using the Connectome 2.0 to create the most detailed map to date of the human connectome. This understanding of a typical connectome could be used to identify variation in a specific patient.
Researchers use the Connectome 2.0 to collect images with a technique called diffusion MRI, which can determine the location and direction of axons. Diffusion MRI tracks the movement of water molecules through the brain. Water travels more easily along bundles of axons than across them, just as it’s easier to walk along a sidewalk than to cross a busy road. Researchers then use various algorithms to piece together the data and create visualizations of the connectome.
A better understanding of the connectome and how it varies from person to person could help researchers identify indicators of neurodegeneration and personalize treatments for conditions such as multiple sclerosis and obsessive-compulsive disorder.
But beyond the clinical applications, Huang and Yendiki share an appreciation for the awe-inspiring images that the Connectome 2.0 makes possible. “The whole reason I got interested in science was being able to see something for the first time that no one else has ever seen, and then to be able to understand it better,” Huang says. Yendiki remembers being “just blown away” when she first saw images produced by diffusion MRI and learned how it works. “I thought it was the most science fiction thing I had ever heard,” she says.
The samples below offer a glimpse of the work they and their colleagues are doing to create a new view of the human brain.
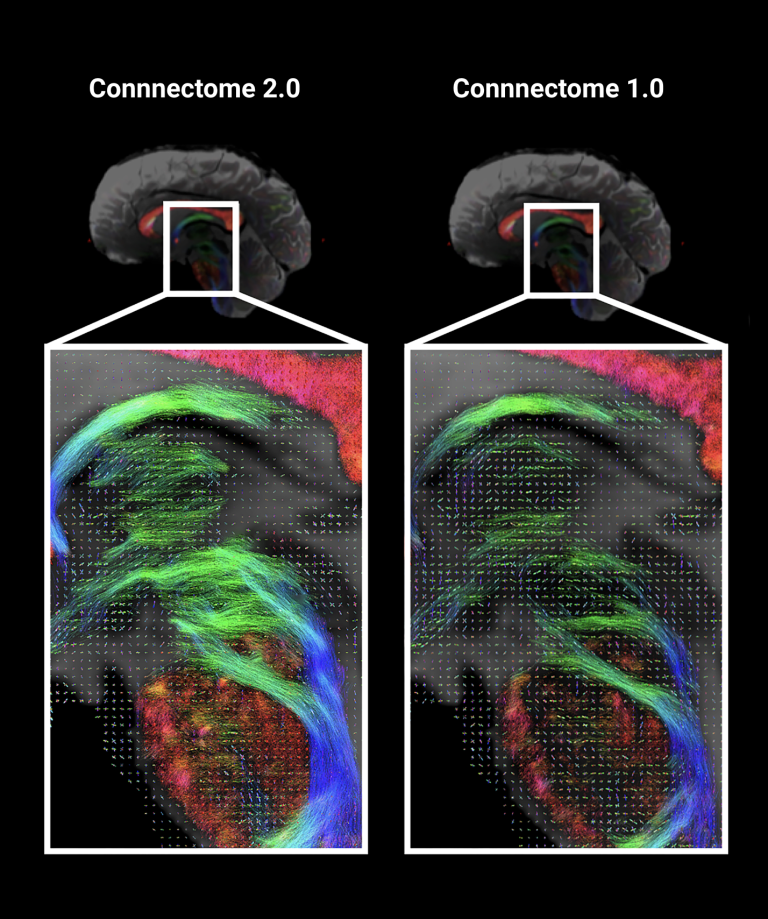
The Connectome 2.0 is the successor to the original Connectome MRI scanner, which was installed at Mass General in 2011. The Connectome 2.0 improves significantly on the design and performance of the original, enabling researchers to produce more detailed maps of the fiber pathways. Above, in the image produced using the Connectome 2.0 (left), small pathways in the brainstem are much more visible than in the image from the Connectome 1.0 (right).
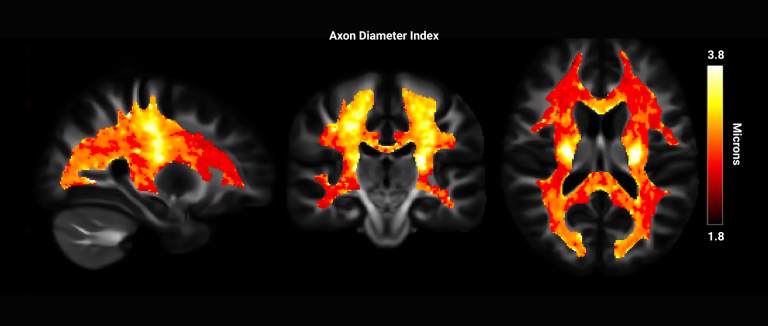
In addition to studying the paths axons take across the brain, researchers are also interested in the fibers’ diameter. Thicker axons conduct electrical signals faster than thinner ones, so knowing the size of axons across different brain regions can indicate how quickly information passes through neural circuits. In some conditions, such as Parkinson’s disease and multiple sclerosis, axon diameter may serve as an early biomarker of disease. Although individual axons are too small to see directly even with the Connectome 2.0, researchers can approximate their diameter. The heatmap above displays the average estimated axon diameter (in microns) in cross sections of the brains of 10 healthy adults. “We’re actively exploring what these structural biomarkers can provide in terms of signs of early neurodegeneration,” Huang says.
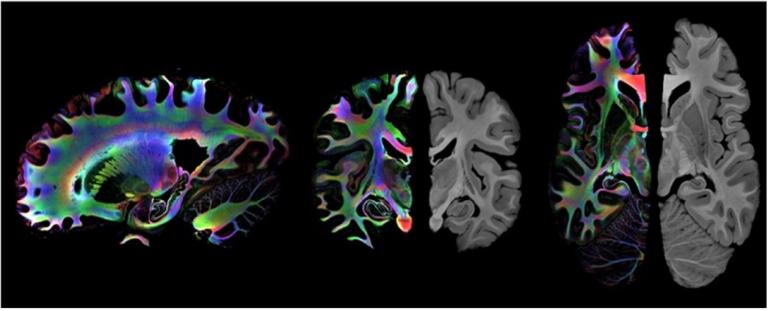
Yendiki is leading a project that is using the Connectome 2.0 to produce extremely high-resolution images of postmortem human brains. Since they can stay in the scanner for long periods, Yendiki says, the postmortem brains allow researchers to “push the limits of what the technology can do when time is not an issue.”
For the images above, her research team carefully placed a brain in a bag filled with a preservative liquid, ensuring that there were no air bubbles that could cause artifacts in the scans. “It’s kind of an art to be able to do this,” she says. As a result, they captured images over the course of several days, far longer than a living person could spend in a scanner.
The grayscale areas show brain anatomy. The colored areas show the paths taken by axons.
Ultimately, Yendiki thinks that for any condition associated with an abnormal brain network, not just in a single location, clinicians will benefit from detailed maps of the connectome. “We would like to have something like a Google Maps of the brain,” she says.
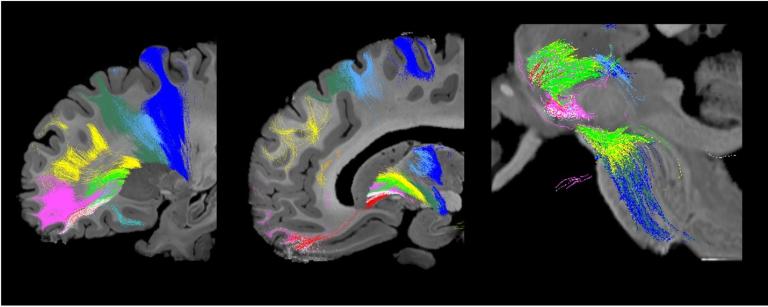
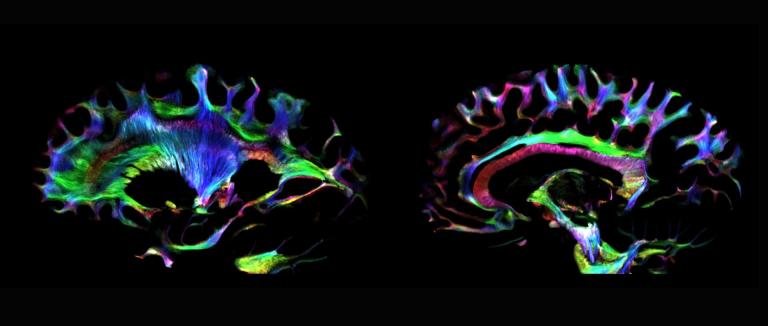
These images offer three views of the paths traveled by axons from the prefrontal cortex (the outer edge of the brain that sits behind the forehead) through the internal capsule to the brainstem. “Having a very detailed map of these small bundles as they travel deep inside the brain is particularly important for both motor and psychiatric disorders,” Yendiki says.
Amos Esty is the editor of Harvard Medicine.